源头

在 Linux 服务器上安装 Prometheus 还有 Grafana 一整套监控在网上有很多很多的信息,但小白同学只是想在自己的 MAC 电脑上做一些看板的展示从网上找文章就比较复杂,上手门槛偏高。

这篇文章简单、快速、直接带小白上手搭建一套 mac 上可用的监控系统,此文的前提是搭建的 mac 电脑上已经安装过 brew 和 docker。

步骤

brew安装软件包

1
2
3
4
5
6
    brew install node_exporter
    brew install prometheus
    brew install Grafana

    brew services start node_exporter
    brew services start grafana

安装mysql 和 redis 的exporter

1
2
    docker run -d --name mysql_exporter  -p 9104:9104 -e DATA_SOURCE_NAME="username:password@(ip:port)/dbname" prom/mysqld-exporter
    docker run -d --name redis_exporter -p 9121:9121 oliver006/redis_exporter:latest --redis.addr redis://宿主机ip:6379

其中如果 redis 也是通过 brew 安装的,如果通过宿主机 ip 链接不上 redis,则需要去掉 bindip 限制,方法为:

  • 执行brew info redis,会发现有 redis 的 config 文件的字样,大概类似 「/opt/homebrew/etc/redis.conf」
  • 编辑器打开 redis 的配置文件。注释掉这一行 bind 127.0.0.1 ::1、找到protected-mode yes修改为protected-mode no
  • 执行brew services restart redis 重启 redis

编辑 prometheus 配置文件/usr/local/etc/prometheus.yml

 1
 2
 3
 4
 5
 6
 7
 8
 9
10
11
12
13
14
15
16
17
18
19
20
21
22
23
24
25
global:
  scrape_interval: 5s
  scrape_timeout: 3s
scrape_configs:
  - job_name: "prometheus"
    scrape_interval: 3s
    static_configs:
    - targets: ["localhost:9090"]
      labels:
        instance: prometheus
  - job_name: "node_exporter"
    static_configs:
    - targets: ["localhost:9100"]
      labels:
        instance: node_exporter
  - job_name: mysqld_exporter
    static_configs:
      - targets: ['localhost:9104']
        labels:
          instance: mysqld_exporter
  - job_name: redis_exporter
    static_configs:
      - targets: ['localhost:9121']
        labels:
          instance: redis_exporter

启动 prometheus

1
prometheus --config.file=/usr/local/etc/prometheus.yml

如果最后没有什么报错,基本这时候分别访问

http://localhost:3000/

http://127.0.0.1:9100/metrics

http://127.0.0.1:9090/targets

就可以分别看到 grafana 、收集的数据、prometheus了

创建数据源并导入看板

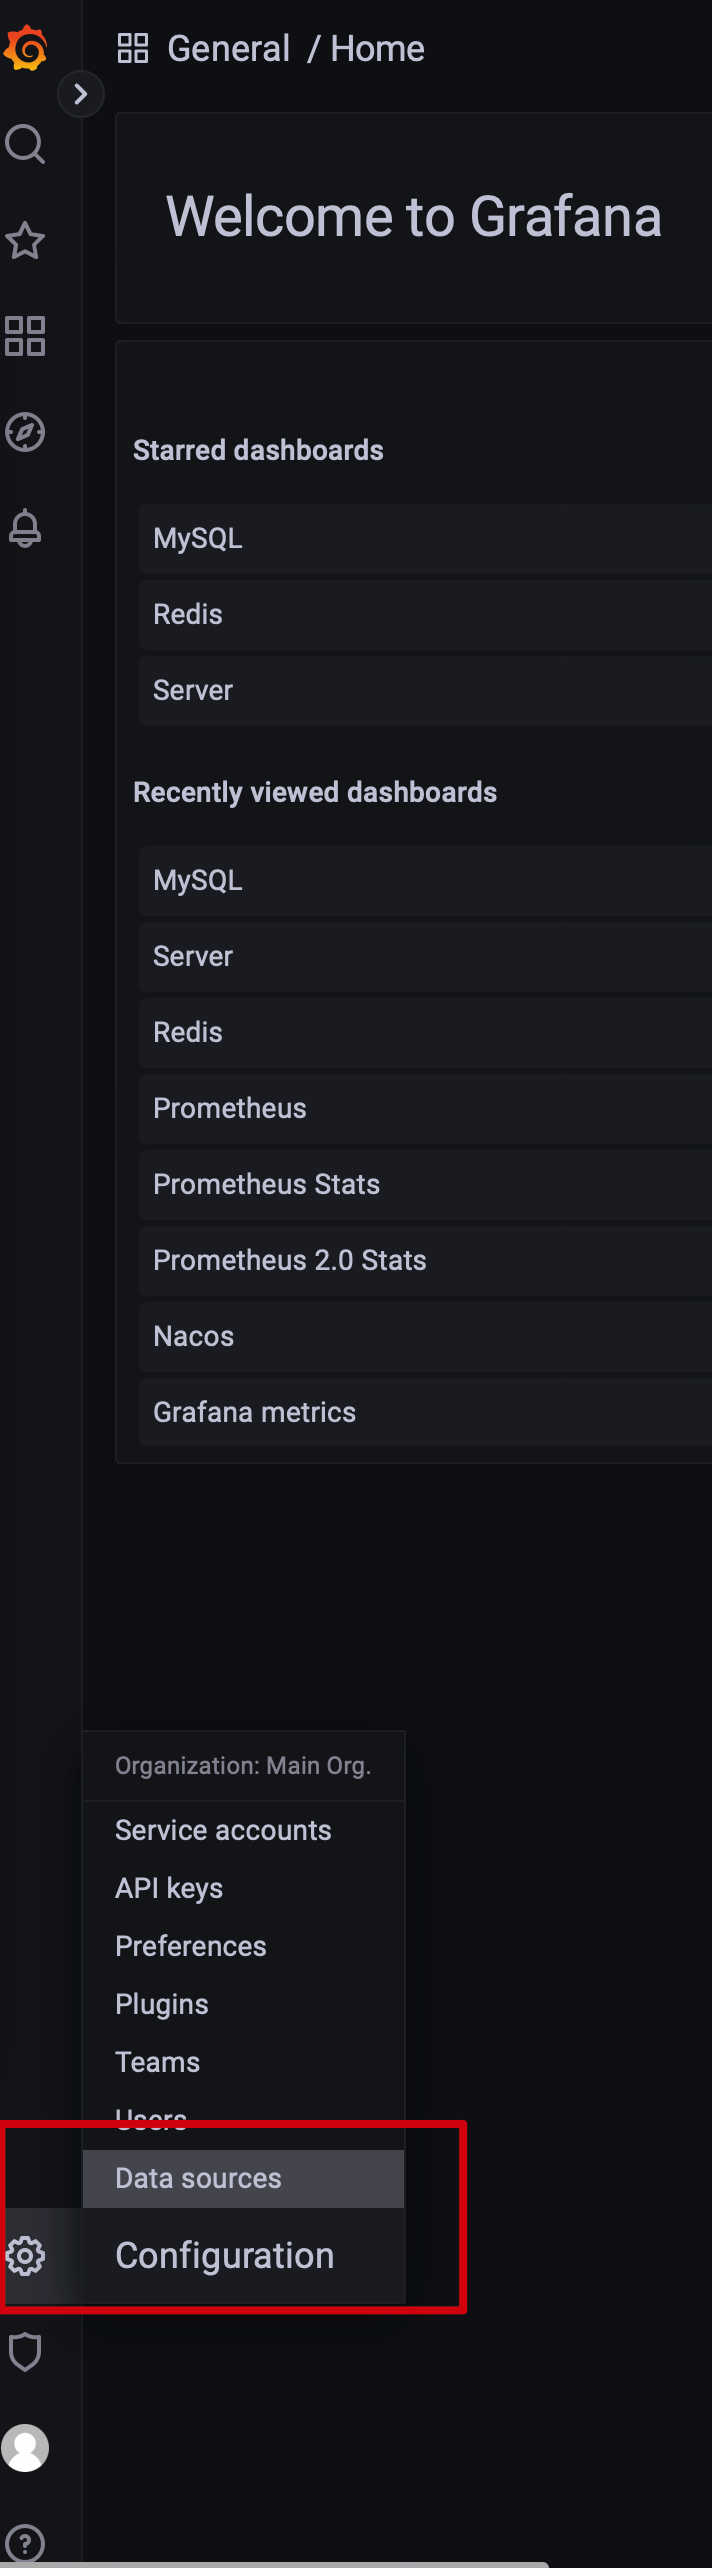
打开grafanahttp://localhost:3000/并输入帐号密码 admin:admin,修改新密码后进入。

找到下图位置Configuration->Data sources

添加数据源

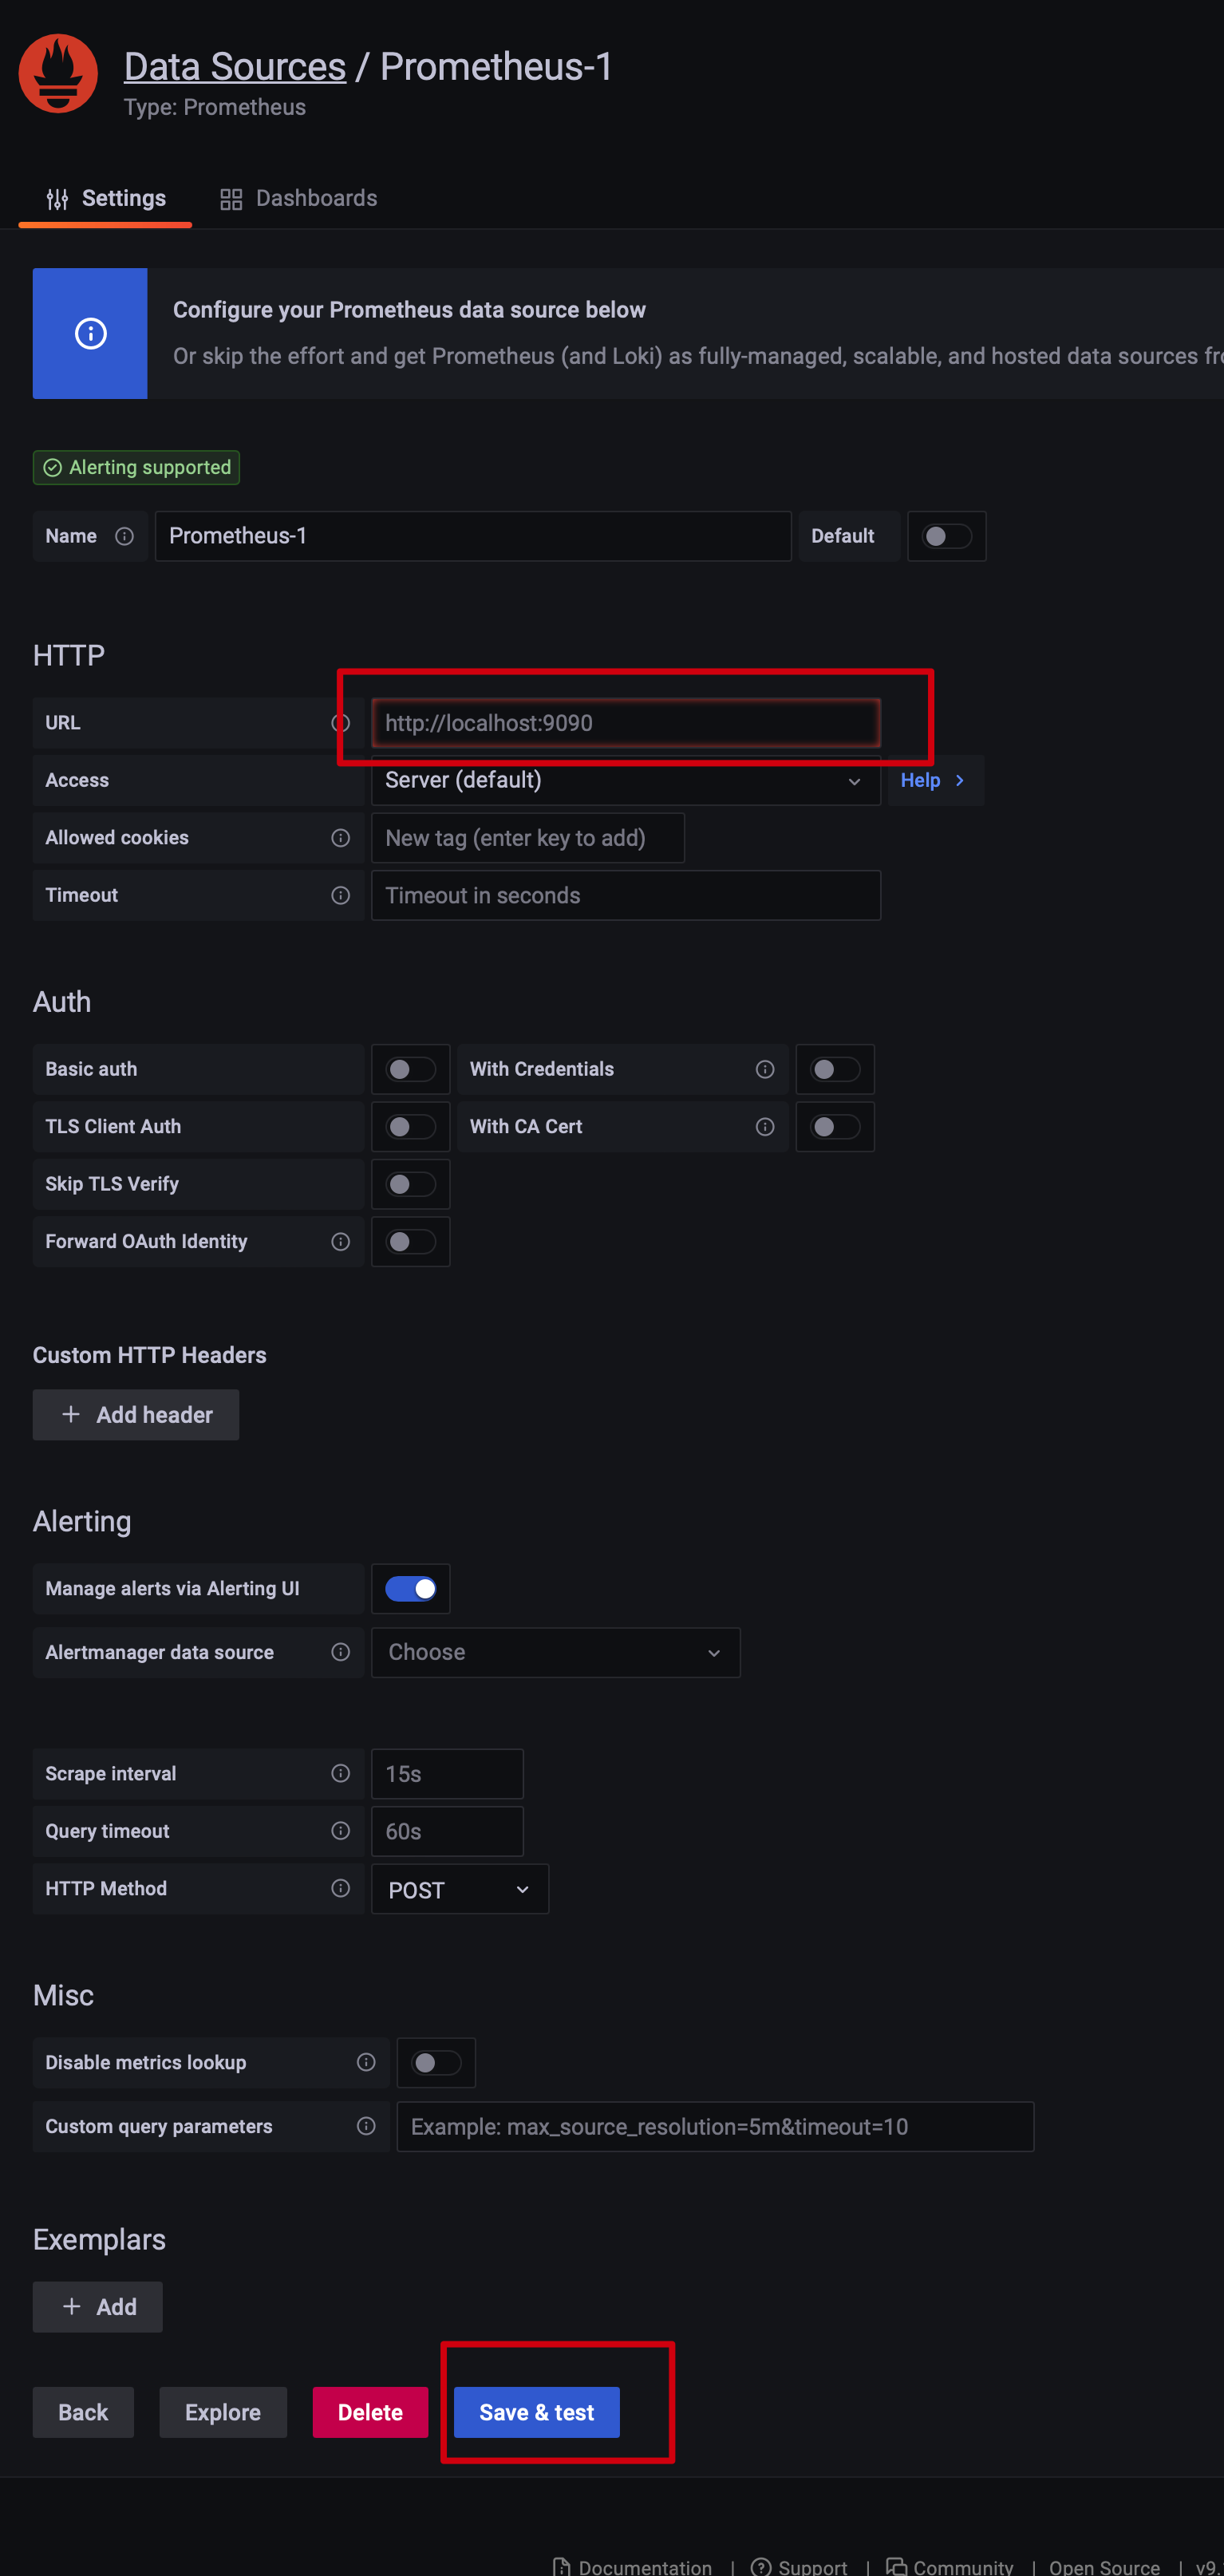
然后点击add data source->选择Prometheus->URL 部分填入http://127.0.0.1:9090/->点击底部Save & test

保存Prometheus数据源

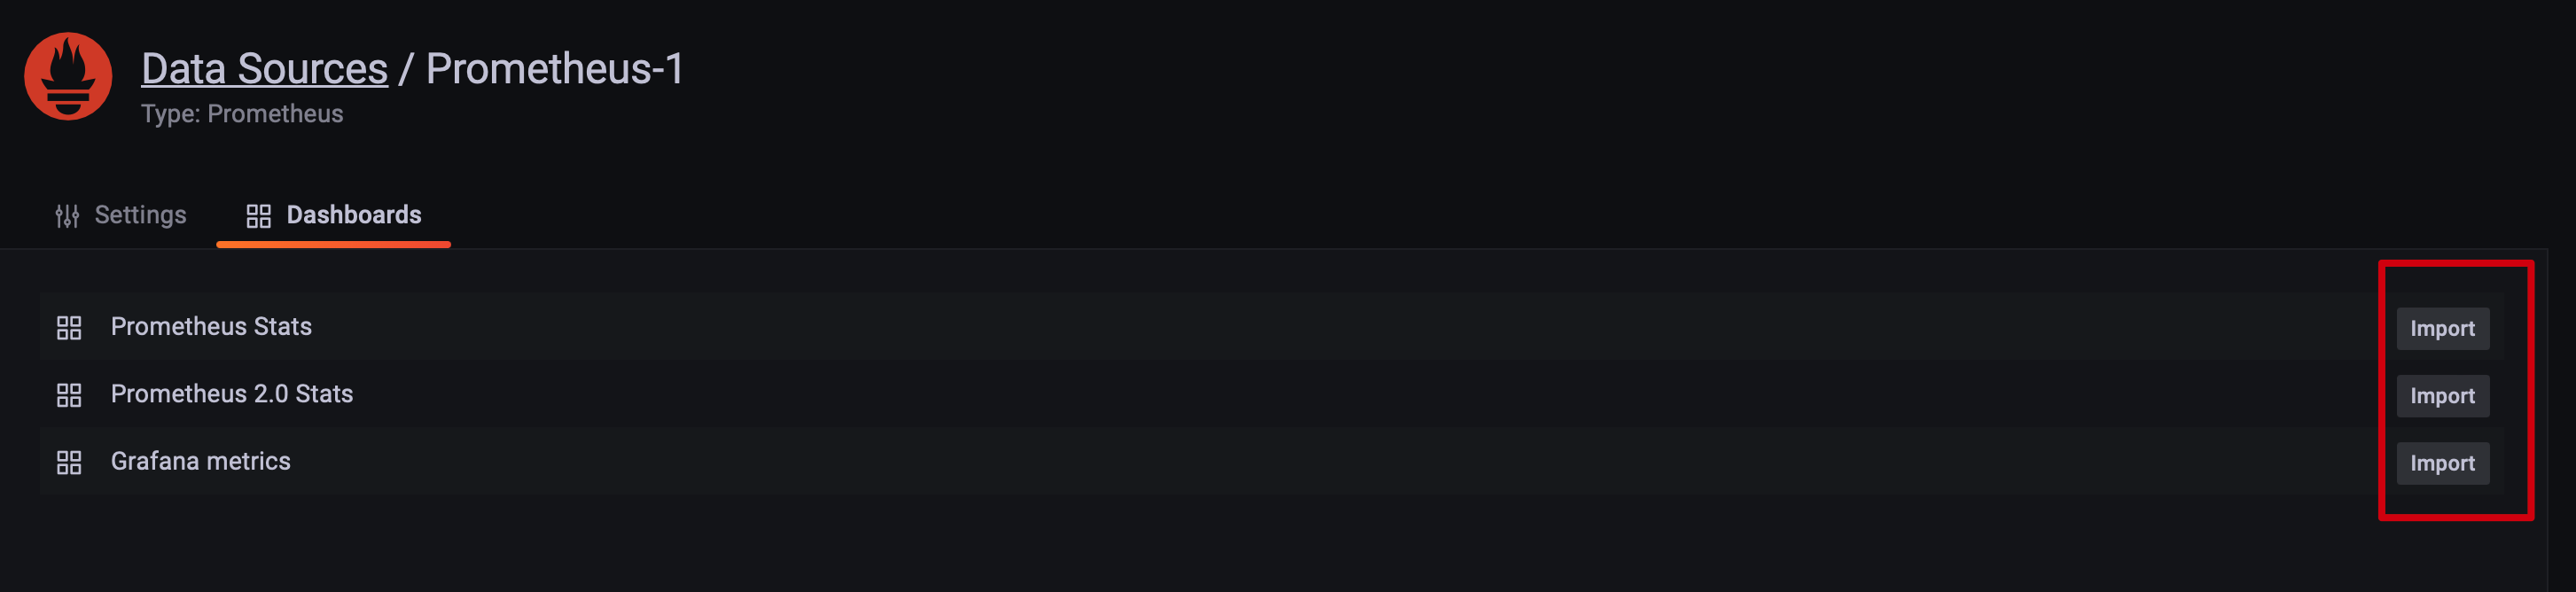
当前页面点击Dashboards,import 自带的几个 Dash board

添加数据源

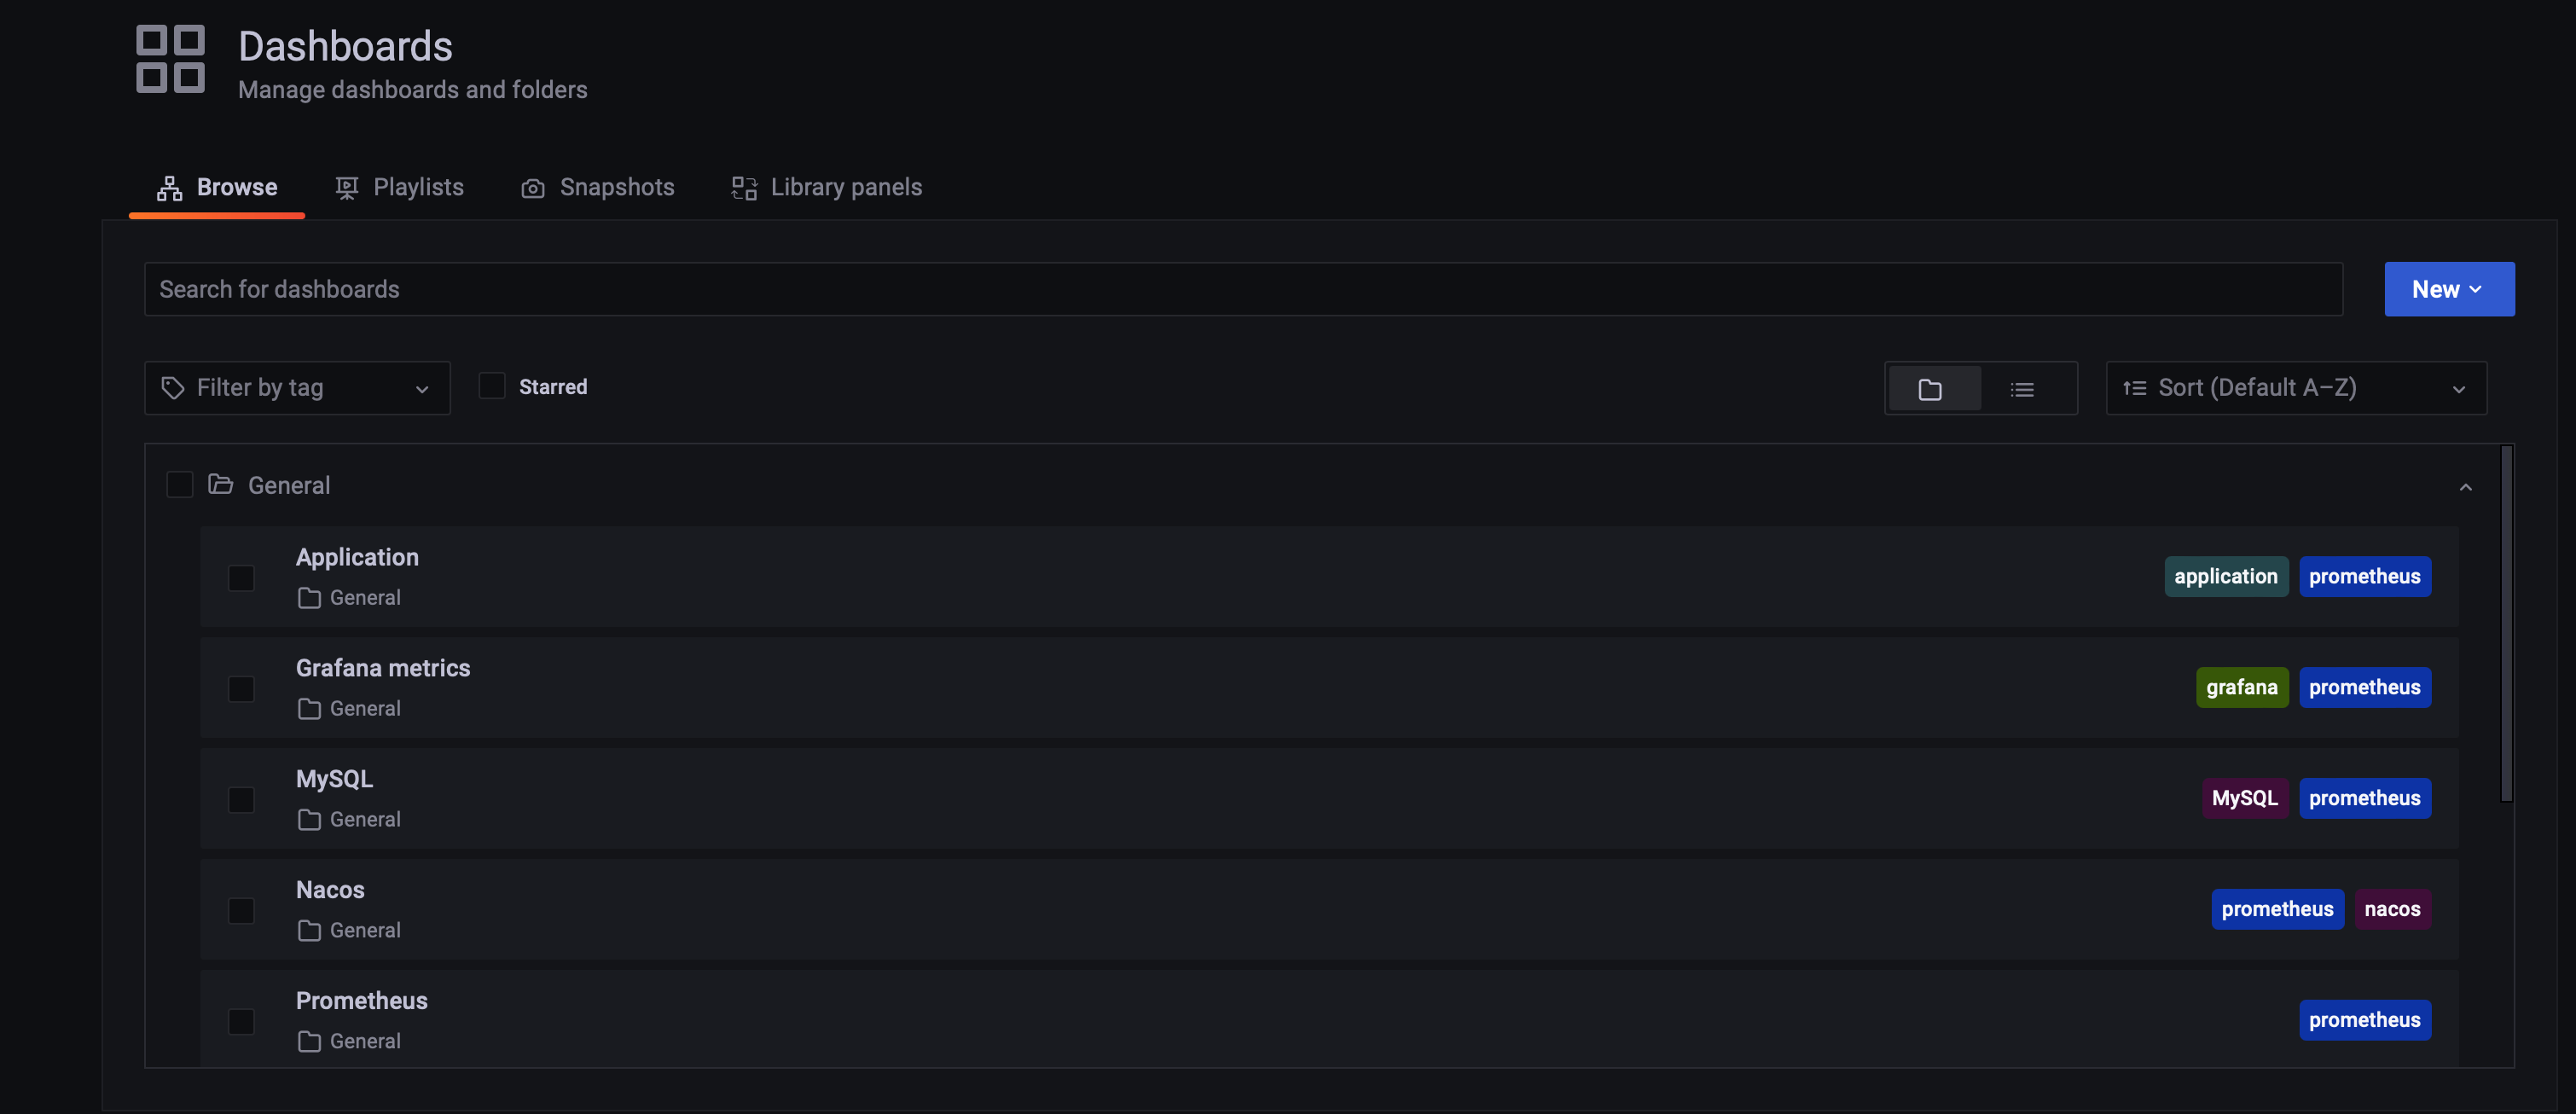
点击左侧导航Dashboards->+ Import导入两个仪表盘,并保存

MySQL-1552836846195.json

Redis-1552836865180.json

点击仪表盘就可以看到监控的数据了

点击仪表盘